
Gambling Industry Gender Gap Analysis, UK 2024/25
This report utilizes gender pay gap data from the UK Government’s official Gender Pay Gap Service website to understand gender pay-gap trends in the UK Gambling Industry
What is the Gender Pay Gap?
The gender pay gap is the difference between what men and women typically earn in an organization.
It compares the average hourly pay of men and women, looking at typical earnings without including overtime. This doesn’t mean women are paid less for the same job, but rather reflects the broader earnings disparity across different types of work and levels of employment.
The UK gender pay gap has been declining slowly over time; in April 2024, it stood at 7.0%, down from 7.5% in 2023.
The gender pay gap differs from equal pay. While equal pay (mandated by the Equality Act 2010) requires that men and women receive the same salary for the same or equivalent work, the gender pay gap is a broader measure of overall earnings differences. This gap doesn’t imply that women are paid less for the same job, but rather reflects systemic patterns in job roles, seniority, and employment types, such as:
- The underrepresentation of women in senior leadership roles.
- Differences in the sectors or job types that men and women typically work in.
- Variations in working patterns, such as part-time employment, which can impact average earnings.
Tracking the Gender Pay Gap Across 25 UK Gambling Companies
This article draws on data from 25 UK employers within the gambling industry.
Our analysis includes comparisons of 2017/18 vs 2024/25, as well as a more recent year-on-year comparison of 2023/24 vs 2024/25. It’s important to note that only 18 of the 25 employers had data available going back to 2017/18. While this limits direct comparison across the full group, examining trends among those with historical data still provides valuable insights into long-term progress.
| Official Employer Name | Display Name in Article |
|---|---|
| Betfair Limited | Betfair |
| Buzz Group Limited | Buzz Group |
| Done Brothers (Cash Betting) Limited (Betfred) | Betfred |
| Entain Marketing (UK) Limited | Entain |
| Fanduel Limited | Fanduel |
| Gamesys Limited | UK Bally’s Interactive Gamesys |
| Gaming Technology Solutions Limited (from 2017 to 2023) to Playtech Software Limited | Playtech |
| Genous Sports UK Limited | Genius Sports |
| Gentin Casinos UK Limited | Genting Casinos |
| Halfords Media (UK) Limited | PokerStars |
| Hestview Limited | Sky Betting & Gaming |
| Hillside (Shared Services 2018) Limited | Bet365 – HSS2018L |
| Hillside (Technology) Limited | Bet365 – HTL |
| Hillside (Tradar Services) Limited | Bet365 – HTSL |
| Hippodrome Casino Limited | Hippodrome Casino |
| Inspired UK Gaming Limited | Inspired Gaming |
| Kindred (London) Limited | Kindred |
| Ladbroke Betting & Gaming Ltd | Ladbrokes |
| Livescore Group Limited | Livescore Group |
| Merkur Slots UK Limited | Merkur Slots |
| Mice and Dice Limited | UK Bally’s Interactive MDL |
| Sports Information Services Limited | SIS.TV |
| The Rank Group PLC | Rank Group |
| William Hill Limited | William Hill |
| Win Technologies (UK) Limited | Betway Group |
Understanding Mean and Median Gender Pay Gap
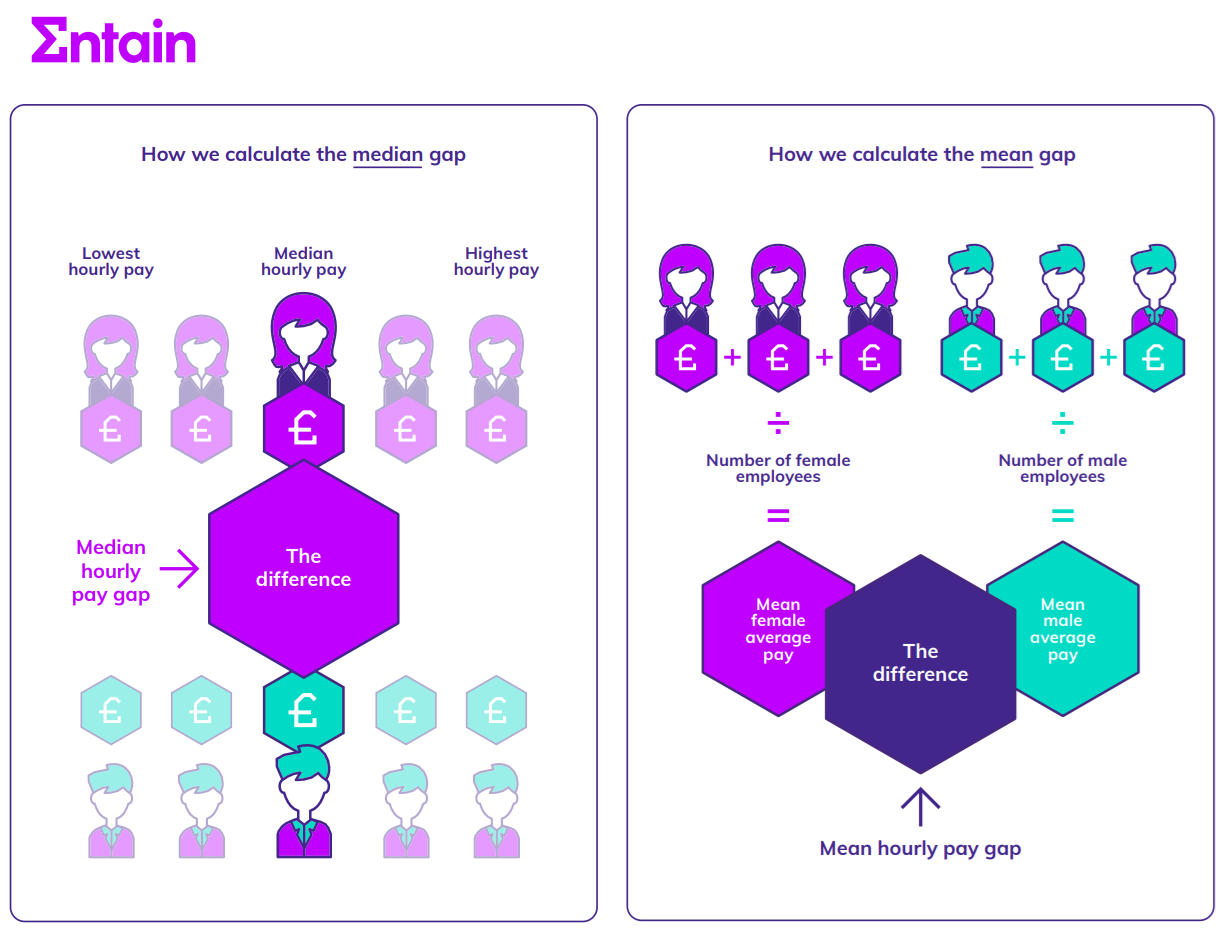
To help clarify how gender pay gaps are calculated, this visual from Entain’s Gender Pay Gap Report illustrates the difference between median and mean pay gap calculations.
- The Mean Pay Gap shows the difference between the average hourly earnings of men and women. The mean pay gap is calculated by adding all male and female salaries separately and dividing by the number of employees in each group. The difference between these averages is the mean pay gap.
- The Median Pay Gap is determined by identifying the middle salary in the list of male and female salaries when ordered from lowest to highest. The difference between these medians represents the median pay gap. The median pay gap offers a clearer representation of pay disparity without outliers (for e.g. extremely high or low salaries).
The figures reported will typically fall into one of two categories; positive or negative percentages.
- Positive Percentage: mean women earn less than men on average..
- Negative Percentage: mean women earn more than men on average.
The Hourly Pay Gap (%)
In this report, we use the median measure, rather than the mean. The median provides a clearer and fairer reflection of typical earnings, as it is not skewed by a small number of very high or very low salaries (such as executive bonuses). This approach is commonly recommended in public reporting and government guidance, as it better illustrates the pay experience of the majority of employees.
Median Hourly Pay Gap (2017–2024 vs 2023–2024)
NOTE: 18 out of 25 employers have available data for both 2017/18 and 2024/25.
Among these 18 companies, the ones showing the biggest improvements (where the gap reduced) and the largest increases (where the gap widened) in the gender pay gap are as follows
Biggest Improvements (where the gap reduced) :
- PokerStars: Reduced gap by 17.8%, from 31.0% to 13.2%
- SIS.TV: Reduced gap by 17.2%, from 17.6% to 0.4%
- Betway Group: Reduced gap by 15.0%, from 20.0% to 5.0%
Largest Increases (where the gap widened):
- Inspired Gaming: Gap increased to 7.4%, from a negative -1.0%
- Kindred: Gap increased by 7.2%, from 3.7% to 10.9%
- Ladbrokes: Gap increased by 2.2%, from 2.0% to 4.2%
Median Hourly Pay Gap: 2023/24 vs 2024/25
NOTE: All 25 employers have data for both 2023/24 and 2024/25.
Among these, the companies with the biggest improvements and largest increases in the gender pay gap are as follows:
Outliers:
- Livescore Group: Reduced the gap from 1.2% to -2.4%, shifting from a small gap in favour of men to one slightly in favour of women.
- Merkur Slots maintained a 0.0% gap, showing continued pay parity year-over-year.
Biggest Improvements (where the gap reduced):
- SIS.TV: Reduced gap by 8.5%, from 8.9% to 0.4%
- Betway Group: Reduced gap by 4.5%, from 9.5% to 5.0%
- William Hill : Reduced gap to 0.0% from 2.8%
Largest Increases (where the gap widened):
- Entain Marketing : Gap increased by 11.4%, from 0.7% to 12.1%
- Fanduel: Gap increased to 5.3%, from 7.7% to 13.0%
- Genius Sports: Gap increased from negative to 5.0%
The Bonus Pay Gap (%)
The Bonus Pay Gap shows the difference in bonuses awarded to men and women over the past year. It is reported using both the mean (average) and median (middle value).
- The Mean Bonus Gap reflects the overall difference in average bonuses but can be influenced by a small number of high earners.
- The Median Bonus Gap shows the typical difference, offering a clearer picture by reducing the impact of outliers.
For this analysis, we focus on the median measure, as bonus distributions often vary widely with some employees receiving significant bonuses while others receive none.
Median Bonus (%) Pay Gap: 2017/18 vs 2024/25
NOTE: 18 out of 25 employers have available data for both 2017/18 and 2024/25.
Among these 18 companies, the ones showing the biggest improvements, as well as the largest increases, in the gender pay gap are as follows:
Outliers:
- Hippodrome Casino recorded a 0.0% gap in both years, maintaining complete parity
- Genius Sports Reduced the gap from 0.0% to -3.0%, shifting from a “no gap” to one slightly in favour of women.
Biggest Improvements (where the gap reduced):
- Buzz Group : Reduced gap by 54.1%, from 92.9% to 38.8%
- PokerStars: Reduced gap by 26.4%, from 44.0% to 17.6%
- Sky Betting & Gaming: Reduced gap by 23.0%, from 34.5% to 11.5%
Largest Increases (where the gap widened):
- Merkur Slots: Gap increased to 38.7%, from a negative -14.6%
- Bet365 – HTL: Gap increased by 14.6%, from 6.2% to 20.8%
- Inspired Gaming: Gap increased to 14.5%, from 0.0%.
Median Bonus (%) Pay Gap: 2023/24 vs 2024/25
NOTE: All 25 employers have data for both 2023/24 and 2024/25.
Among these, the companies with the biggest improvements and largest increases in the gender pay gap are as follows:
Outliers:
- LiveScore Group maintained a negative gender pay gap in both years, meaning women continued to receive higher bonuses than men on average. The gap slightly narrowed from -13.4% to -7.8%, but the direction still favors female employees, a rare trend among the companies analysed.
- Hippodrome Casino recorded a 0.0% gap in 2024/25.
Biggest Improvements (where the gap reduced) :
- Genting Casinos: Reduced gap by 16.2%, from 33.3% to 17.1%
- Fanduel: Reduced gap by 15.16%, from 26.4% to 11.3%
- Sky Betting & Gaming: Reduced gap by 14.6%, from 26.1% to 11.5%
Largest Increases (where the gap widened):
- Merkur Slots : Gap increased to 38.7%, from a negative 4.5%
- Bet365 – HTL: Gap increased by 32.6%, from 29.5% to 62.1%
- Playtech: Gap increased by 28.9%, from 20.2% to 49.1%
Percentage of Men Employees Receiving Bonuses
The proportion of male versus female employees receiving any bonus is a powerful indicator of access to additional compensation. It doesn’t measure the size of the bonuses, but rather highlights how many employees in each group received any bonus at all, revealing potential disparities in recognition and reward structures.
To track trends over time, we grouped employers into three categories based on the percentage of their male employees who received a bonus:
- Low Distribution (0–50%): Fewer than half of male employees received a bonus.
- Moderate Distribution (50.1–80%): A majority of male employees received bonuses.
- High Distribution (80.1–100%): Nearly all male employees received some form of bonus.
This breakdown helps show how bonus participation—regardless of amount—has shifted across the sector.
By comparing these categories between 2017/18 and 2023/24, we analyzed how bonus structures have changed over time.
Male Bonus Distribution Trends (2017/18 vs. 2024/25)
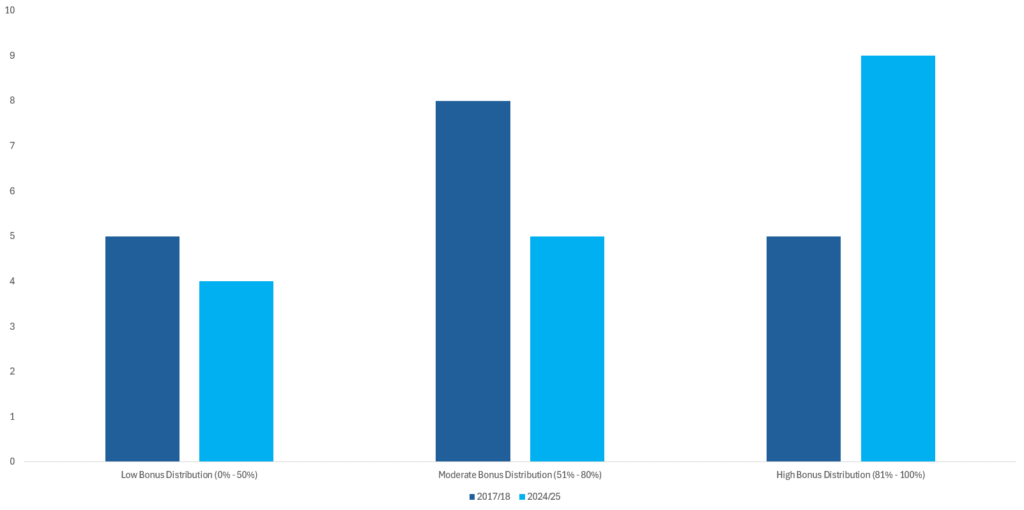
| Male % Bonus Category | Employer Count in 2017/18 | Employer Count in 2024/25 |
|---|---|---|
| Low Bonus Distribution (0% – 50%) | 5 | 4 |
| Moderate Bonus Distribution (50.1% – 80%) | 8 | 5 |
| High Bonus Distribution (80.1% – 100%) | 5 | 9 |
NOTE: 18 out of 25 employers have available data for both 2017/18 and 2024/25.
- Low Bonus Distribution (0% – 50%) : The number of employers with low male bonus participation slightly declined (from 5 to 4)
- Moderate Bonus Distribution (50.1% – 80%) : The number of employers in the moderate range also decreased (from 8 to 5).
- High Bonus Distribution (80.1% – 100%) : The number of employers in high participation range nearly doubled, from 5 to 9
Male Bonus Distribution Trends (2023/24 vs. 2024/25)
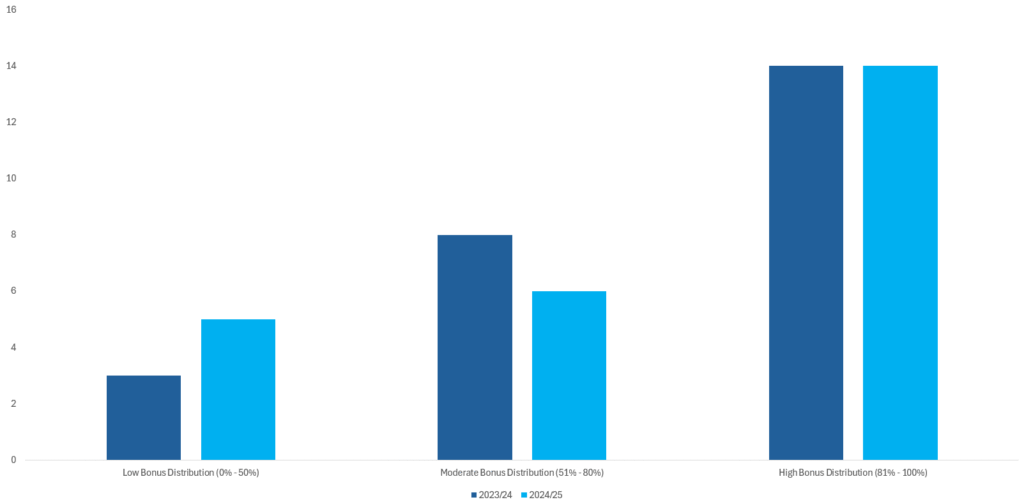
| Male % Bonus Category | Employer Count in 2023/24 | Employer Count in 2024/25 |
|---|---|---|
| Low Bonus Distribution (0% – 50%) | 3 | 5 |
| Moderate Bonus Distribution (50.1% – 80%) | 8 | 6 |
| High Bonus Distribution (80.1% – 100%) | 14 | 14 |
NOTE: All 25 employers have data for both 2023/24 and 2024/25.
- Low Bonus Distribution (0% – 50%) : The number of employers in the low distribution category increased from 3 to 5 employers.
- Moderate Bonus Distribution (50.1% – 80%): The moderate distribution category group declined slightly from from 8 to 6 employers.
- High Bonus Distribution (80.1% – 100%) : The high bonus distribution group remained steady at 14 employers.
Percentage of Women Employees Receiving Bonuses
To track trends over time, we grouped employers into three categories based on the percentage of their female employees who received a bonus.
The categories are as follows:
- Low Distribution (0–50%): Fewer than half of female employees received a bonus.
- Moderate Distribution (50.1–80%): A majority of female employees received bonuses.
- High Distribution (80.1–100%): Nearly all female employees received some form of bonus.
This breakdown helps show how bonus participation—regardless of amount—has shifted across the sector.
Female Bonus Distribution Trends (2017/18 vs. 2024/25)

| Female % Bonus Category | Employer Count in 2017/18 | Employer Count in 2024/25 |
|---|---|---|
| Low Bonus Distribution (0% – 50%) | 5 | 4 |
| Moderate Bonus Distribution (50.1% – 80%) | 6 | 5 |
| High Bonus Distribution (80.1% – 100%) | 7 | 9 |
NOTE: 18 out of 25 employers have available data for both 2017/18 and 2024/25.
- Low Bonus Distribution (0% – 50%) : The number of employers in the low bonus group dropped from 5 to 4.
- Moderate Bonus Distribution (50.1% – 80%) : The number of employers in this moderate bonus distribution category also saw a decrease from 6 to 5 employers.
- High Bonus Distribution (80.1% – 100%) : The number of employers in this High bonus distribution group increased from 7 to 9 employers.
Female Bonus Distribution Trends (2023/24 vs. 2024/25)
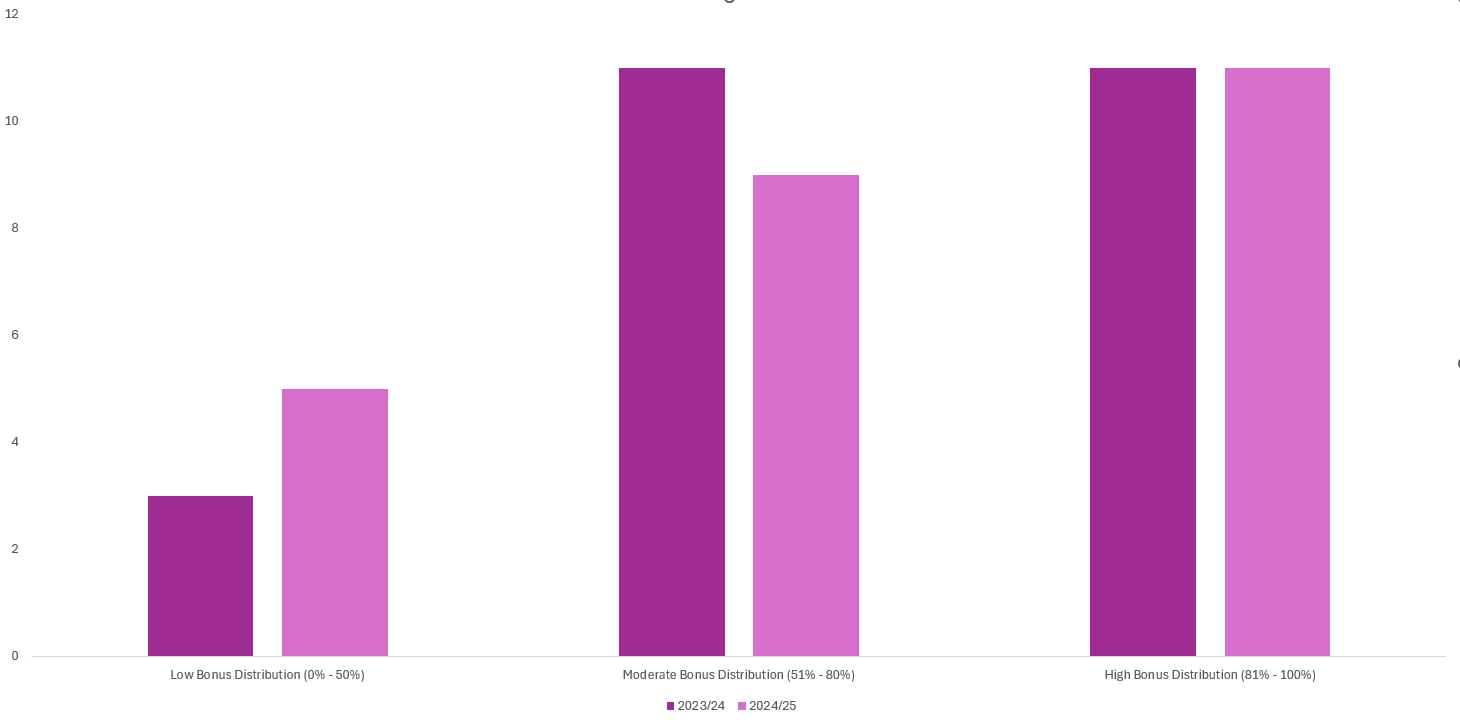
| Female % Bonus Category | Employer Count in 2023/24 | Employer Count in 2024/25 |
|---|---|---|
| Low Bonus Distribution (0% – 50%) | 3 | 5 |
| Moderate Bonus Distribution (50.1% – 80%) | 11 | 9 |
| High Bonus Distribution (80.1% – 100%) | 11 | 11 |
NOTE: All 25 employers have data for both 2023/24 and 2024/25.
- Low Bonus Distribution (0% – 50%): The number of employers in this bonus distribution category increased from 3 to 5 employers
- Moderate Bonus Distribution (50.1% – 80%): The number of employers in this bonus distribution category decreased from 11 to 9 employers.
- High Bonus Distribution (80.1% – 100%): The number of employers in this bonus distribution category remained unchanged at 11 employers.
Pay Distribution by Quartiles
How the quartile system works.
An employer ranks all employees from lowest to highest paid.
This ranked list is then divided into four equal groups (quartiles):
- Lower quartile (lowest 25% of earners)
- Lower middle quartile (25-50%)
- Upper middle quartile (50-75%)
- Upper quartile (highest 25% of earners)
For each quartile, organizations must report the percentage of male and female employees.
This reveals whether women are under-represented in higher-paying positions, which is often a significant factor contributing to the overall gender pay gap.
This visual below, sourced from the UK Government Gender Pay Gap Service, compares the gender distribution across hourly pay quartiles for two companies in the gambling industry, Merkur Slots and PokerStars (reporting year 2024/25).
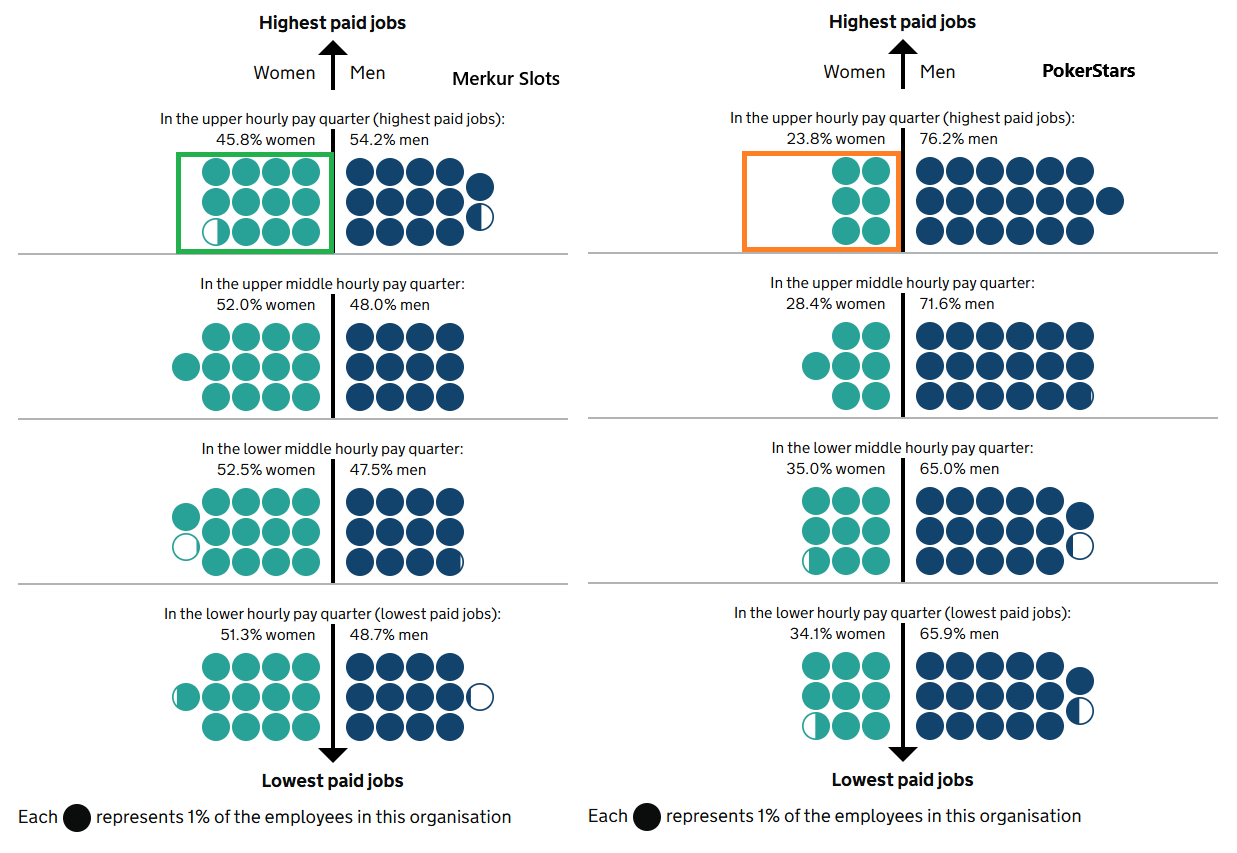
Each dot in the visual represents 1% of the workforce, helping to illustrate where women and men are positioned within the pay structure—from the lowest to the highest paid roles.
- Merkur Slots shows relatively balanced gender representation across all quartiles, including the top, reflecting its 0.0% reported median hourly pay gap.
- PokerStars, by contrast, has a higher concentration of men in the top three quartiles, especially in the highest paid roles, where women represent just 23.8%. This distribution supports the reported 13.2% median hourly pay gap.
Female Representation in Pay Quartiles – Categorization System
To assess how women are distributed across pay levels, we grouped employers into three categories based on the percentage of female employees in each pay quartile:
- Low Representation: 0% to 25% of employees in the quartile are women
- Medium Representation: 25.1% to 40% of employees in the quartile are women
- High Representation: Above 40.1% of employees in the quartile are women
This classification helps illustrate whether women are more heavily concentrated in lower-paid roles or are equally represented across the full pay scale, including senior, higher-paid positions.
Each quartile represents 25% of the workforce ranked by pay, from the lowest earners (lower quartile) to the highest earners (top quartile). A healthy gender balance would ideally show consistent representation across all quartiles.
Female Representation Lower Quartile (Lowest 25% of Earners) : 2017-18 vs 2024-25
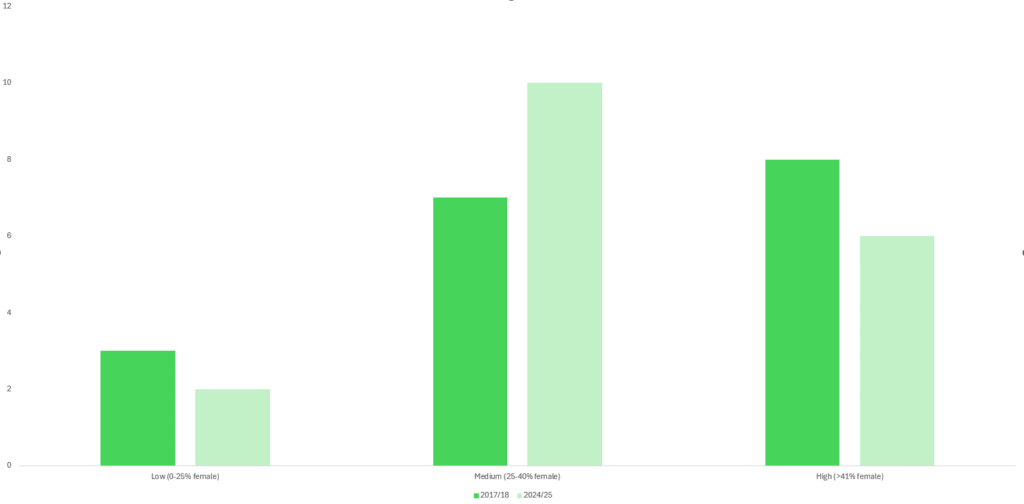
This comparison shows how many companies had low, medium, or high female representation among their lowest-paid staff:
| Female Representation Category: Lower Quartile (%) | 2017-18 | 2024/25 |
|---|---|---|
| Low (0-25% female) | 3 | 2 |
| Medium (25.1-40% female) | 7 | 10 |
| High (>40.1% female) | 8 | 6 |
Female Representation Top Quartile (Highest 25% of Earners) :2017-18 vs 2024-25
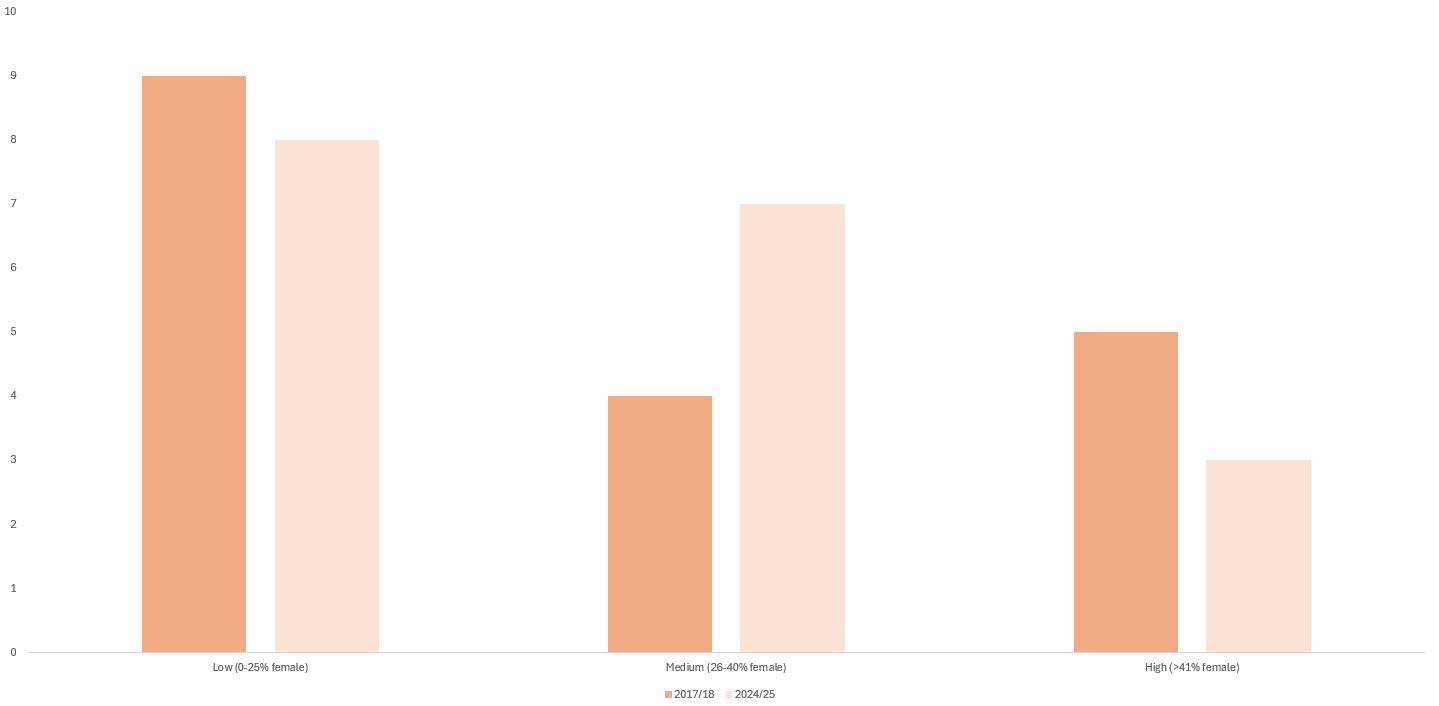
| Female Representation Category: Top Quartile (%) | 2017-18 | 2024/25 |
|---|---|---|
| Low (0-25% female) | 9 | 8 |
| Medium (25.1-40% female) | 4 | 7 |
| High (>40.1% female) | 5 | 3 |
Female Representation Lower Quartile (Lowest 25% of Earners): 2023-24 vs 2024-25
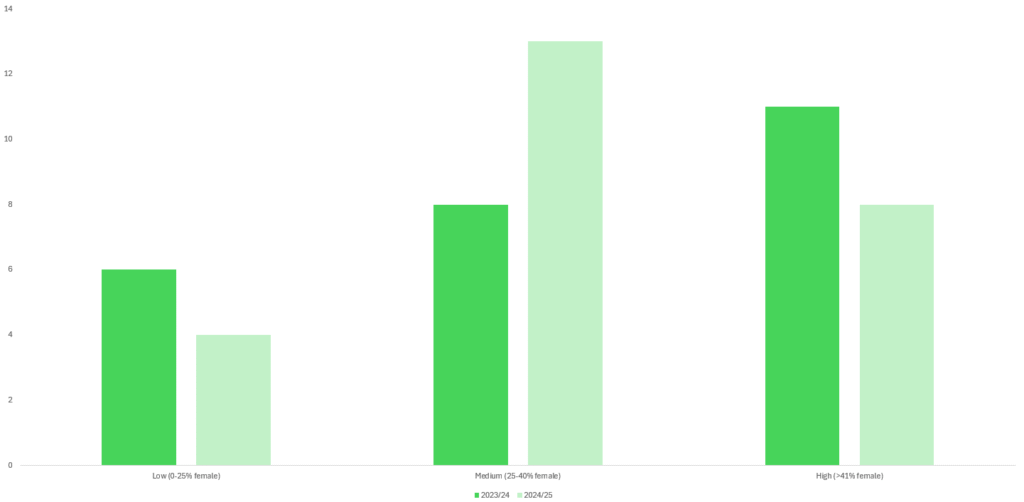
| Female Representation Category: Lower Quartile (%) | 2023/24 | 2024/25 |
|---|---|---|
| Low (0-25% female) | 6 | 4 |
| Medium (25.1-40% female) | 8 | 13 |
| High (>40.1% female) | 11 | 8 |
Female Representation Top Quartile (Highest 25% of Earners): 2023-24 vs 2024-25
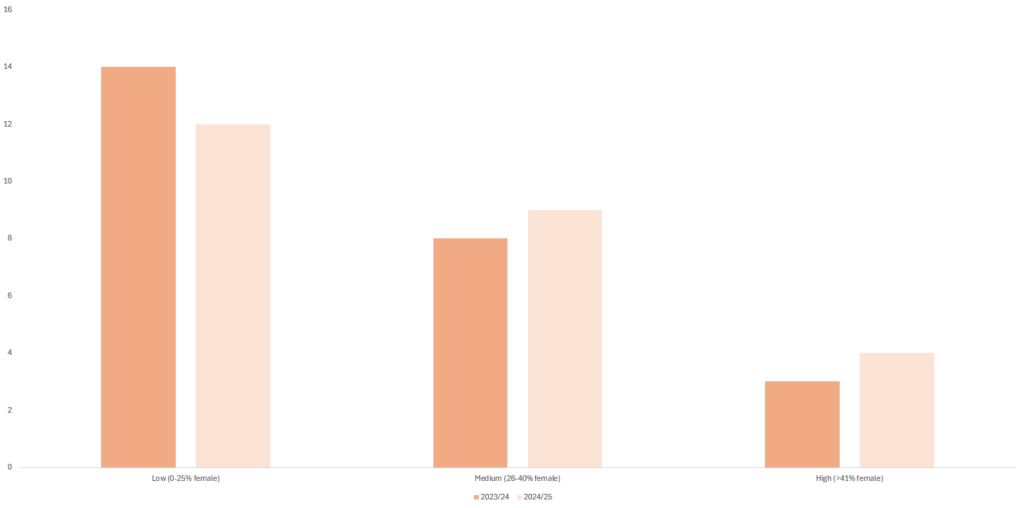
| Female Representation Category: Top Quartile (%) | 2023/24 | 2024/25 |
|---|---|---|
| Low (0-25% female) | 14 | 12 |
| Medium (25.1-40% female) | 8 | 9 |
| High (>40.1% female) | 3 | 4 |
Gambling Industry, Where Do We Stand?
The UK gambling industry has made encouraging strides in narrowing the gender pay gap over the past seven years, though key challenges still persist. In this summary, we focus on the most recent and complete dataset—comparing figures from 2023/24 to 2024/25, to provide a clearer view of current progress across all 25 employers.
The Hourly Pay Gap
What does it measure: Think of it like this: if all the men in a company put their hourly pay into one pile, and all the women did the same, and we compared the averages, the difference between those two amounts is the hourly pay gap. It’s shown as a percentage, so if the gap is 10%, that means men earn about 10% more per hour on average than women.
When we look at average hourly pay across 25 gambling companies, the results are mixed. Some companies made real progress. For example, SIS.TV, Betway, and William Hill reduced their pay gaps significantly, bringing men’s and women’s earnings much closer together. At Livescore Group, the gap actually reversed, with women now earning more than men on average.
But not every company moved in the right direction. Entain Marketing, Fanduel, and Genius Sports saw their gaps widen, meaning the difference between men’s and women’s pay got worse in just one year.
In total:
- 11 companies improved,
- 6 stayed about the same, and
- 8 saw their pay gaps increase.
So, while there are signs of progress, it’s uneven. Some companies are clearly taking action, but others still have work to do to improve gender balance across roles and pay levels.
The Bonus Pay Gap
What does it measure: The bonus pay gap looks at the difference in bonuses given to men and women. Bonuses can include rewards for performance, commissions, or profit-sharing. If a company has a 30% bonus gap, that means men get bonuses that are, on average, 30% bigger than women’s. Bonus gaps are often larger than pay gaps because big bonuses usually go to higher-paid roles, where men are more likely to be.
When examining the more recent 2023/24 to 2024/25 comparison across all 25 companies, we see less progress.
- 7 companies reduced their bonus gaps.
- 3 companies stayed about the same.
- 15 companies saw their gaps grow.
Some stand-out examples:
- Livescore Group had a reverse gap, women got bigger bonuses than men, which is rare.
- Hippodrome Casino reported a perfect balance, with no gap at all (0.0%).
Bonus gaps change more than pay gaps from year to year. That’s likely because bonuses depend on things like how well the company did, changes in who’s in charge, or which roles got rewarded. But the fact that many companies still report big gaps (over 40% in some cases) shows there’s more to do, especially in making sure women have equal access to the high-level jobs that come with the biggest bonuses.
Employees Receiving Bonuses
What does it measure: This metric shows what percentage of men and women received any type of bonus payment during the year, regardless of size. It helps us understand if bonus opportunities are equally available to employees of both genders across the organization.
What the data shows for 2023/24 vs 2024/25. Across all 25 companies, there was a small step backward in bonus access:
- For both men and women, the number of companies where less than half of employees got a bonus, increased from 3 to 5.
- The number of companies in the moderate range (50.1–80% of staff getting bonuses) fell, from 8 to 6 for men, and 11 to 9 for women.
- The number of companies where most employees (8o.1–100%) got a bonus stayed the same: 14 for men, 11 for women.
So, what does it mean?
Bonus opportunities were slightly less common in 2024/25 than the year before. While many companies are still offering bonuses to most of their staff, a few seem to be pulling back,possibly due to cost-cutting or changing business strategies. It’s a reminder that progress isn’t always steady and that equal access to rewards like bonuses still needs attention.
Pay Quartiles and Gender Representation
What does it measure: Pay quartiles divide all employees into four equal groups based on salary levels, from the lowest 25% of earners to the highest 25%. By looking at the gender breakdown in each quartile, we can see if women are reaching higher-paying positions or are concentrated in lower-paid roles. This breakdown helps us understand the root of pay gaps, beyond just averages.
The data shows a persistent pattern of female underrepresentation in higher-paying roles and overrepresentation in lower-paying positions.
2024/25 data shows us:
- Lower Quartile: In most companies, women are well represented in the lowest-paid group. Many companies have over 40% female representation here.
- Top Quartile: Far fewer companies show high female representation in their highest-paid roles. In fact, 12 out of 25 companies had low (0–25%) female representation in the top quartile.
Even if companies pay equally for the same job, if men dominate the top-paying positions, it will still result in a gender pay gap. This section reveals that women are still underrepresented in senior or high-paying roles in many companies.
Final Thoughts
The median gender pay gap across the 25 gambling companies in this report varies widely, from companies with near-zero gaps to those with double-digit disparities.
Despite encouraging improvements at several companies, the 2024/25 data shows that many still report gender pay gaps higher than the UK national average of 7%. While some organizations are making real changes, others have seen setbacks, especially in bonus distribution and representation in higher-paid roles. That means the industry is moving in the right direction, but not fast enough, and not evenly. Continued action, transparency, and commitment are essential.
Transparency and accountability
In the UK, companies with 250 or more employees are legally required to report their gender pay gap figures annually. Alongside submitting this data to the government’s official Gender Pay Gap Service, employers must publish the results on their own websites and keep the information available for at least three years. While not mandatory, companies are also encouraged to share a supporting narrative explaining why a gap exists and what they are doing to address it.
Understanding the problem is the first step toward fixing it. And some employers are indeed taking action. Across the reports we reviewed, common strategies to reduce gender pay gaps include:
- Targeted recruitment to bring more women into senior roles
- Bias training for hiring managers and leadership teams
- Mentoring and leadership programs aimed at retaining and promoting women
- Pay band reviews to ensure fairness across similar roles
- Flexible working options, which can support career progression for employees with caregiving responsibilities
While numbers only tell part of the story, they serve as a powerful accountability tool. The more transparent companies are, and the more willing they are to act—the closer we get to achieving meaningful gender parity in the workplace.